Appendix VIII E. Potentiometric Determination of Ionic Concentration Using Ion-selective Electrodes
Ideally, the potential E of an ion-selective electrode varies linearly with the logarithm of the activity ai of a given ion, as expressed by the Nernst equation:
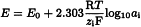
E0 | = | part of the constant potential due to the apparatus used, |
R | = | gas constant, |
T | = | absolute temperature, |
F | = | Faraday’s number, |
zi | = | charge number of the ion including its sign. |
At a constant ionic strength, the following holds:
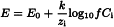
Ci | = | molar concentration of the ion, |
f | = | the activity coefficient (ai=fCi), |
k | = |  |
If: 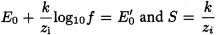
S | = | slope of the calibration curve of the electrode, |
the following holds: 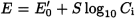
and for 
The potentiometric determination of the ion concentration is carried out by measuring the potential difference between two suitable electrodes immersed in the solution to be examined; the indicator electrode is selective for the ion to be determined and the other is a reference electrode.
Apparatus Use a voltmeter allowing measurements at least to the nearest 0.1 millivolt and whose input impedance is at least one hundred times greater than that of the electrodes used.
Ion-selective electrodes may be primary electrodes with a crystal or non-crystal membrane or with a rigid matrix (for example, glass electrodes), or electrodes with charged (positive or negative) or uncharged mobile carriers, or sensitised electrodes (enzymatic-substrate electrodes, gas-indicator electrodes). The reference electrode is generally a silver–silver chloride electrode with suitable junction liquids producing no interference.
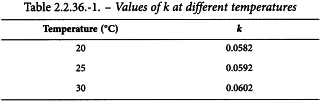
Procedure Carry out each measurement at a temperature constant to ± 0.5 °C, taking into account the variation of the slope of the electrode with temperature (see Table 2.2.36.-1). Adjust the ionic strength and possibly the pH of the solution to be analysed using the buffer reagent described in the monograph and equilibrate the electrode by immersing it in the solution to be analysed, under slow and uniform stirring, until a constant reading is obtained.
If the electrode system is used frequently, check regularly the repeatability and the stability of responses, and the linearity of the calibration curve or the calculation algorithm in the range of concentrations of the test solution; if not, carry out the test before each set of measurements. The response of the electrode may be regarded as linear if the slope S of the calibration curve is approximately equal to k/zi, per unit of pCi.
METHOD I (DIRECT CALIBRATION)
Measure at least three times in succession the potential of at least three reference solutions spanning the expected concentration of the test solution. Calculate the calibration curve, or plot on a chart the mean potential E obtained against the concentration of the ion to be determined expressed as -log10 Ci or pCi.
Prepare the test solution as prescribed in the monograph; measure the potential three times and, from the mean potential, calculate the concentration of the ion to be determined using the calibration curve.
METHOD II (MULTIPLE STANDARD ADDITIONS)
Prepare the test solution as prescribed in the monograph. Measure the potential at equilibrium ET of a volume VT of this solution of unknown concentration CT of the ion to be determined. Make at least three consecutive additions of a volume VS negligible compared to VT (VS ≤ 0.01VT) of a reference solution of a concentration CS known to be within the linear part of the calibration curve. After each addition, measure the potential and calculate the difference of potential ΔE between the measured potential and ET. ΔE is related to the concentration of the ion to be determined by the equation:
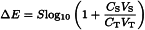
or
VT | = | volume of the test solution, |
CT | = | concentration of the ion to be determined in the test solution, |
VS | = | added volume of the reference solution, |
CS | = | concentration of the ion to be determined in the reference solution, |
S | = | slope of the electrode determined experimentally, at constant temperature, by measuring the difference between the potentials obtained with two reference solutions whose concentrations differ by a factor of ten and are situated within the range where the calibration curve is linear. |
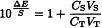
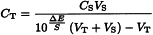
Plot on a graph  (y-axis) against VS (x-axis) and extrapolate the line obtained until it intersects the x-axis. At the intersection, the concentration CT of the ion to be determined in the test solution is given by the equation:

METHOD III (SINGLE STANDARD ADDITION)
To a volume VT of the test solution prepared as prescribed in the monograph, add a volume VS of a reference solution containing an amount of the ion to be determined known to give a response situated in the linear part of the calibration curve. Prepare a blank solution in the same conditions. Measure at least three times the potentials of the test solution and the blank solution, before and after adding the reference solution. Calculate the concentration CT of the ion to be analysed using the following equation and making the necessary corrections for the blank:
VT | = | volume of the test solution or the blank, |
CT | = | concentration of the ion to be determined in the test solution, |
VS | = | added volume of the reference solution, |
CS | = | concentration of the ion to be determined in the reference solution, |
ΔE | = | difference between the average potentials measured before and after adding VS, |
S | = | slope of the electrode determined experimentally, at constant temperature, by measuring the difference between the potentials obtained from two reference solutions whose concentrations differ by a factor of ten and are situated within the range where the calibration curve is linear. |