Appendix II H. Raman Spectroscopy
In Raman spectroscopy a sample is irradiated with an intense monochromatic light source (usually a laser). Most of the radiation is scattered from the sample at the same wavelength as that of the incident light; this process is known as Rayleigh scattering or elastic light scattering. Only 10-6 to 10-8 of the incident photons are scattered from the sample at wavelengths shifted from the original source wavelength; this scattered light is known as Raman scatter or inelastic light scatter. The differences between the incident light source wavelength and the Raman scattered wavelengths are known as the Raman shifts and are related to the molecular vibrations within the sample. The scattered light with lower energy is called Stokes scatter and with higher energy is called anti-Stokes scatter. Typically, Stokes scatter is analysed.
A Raman spectrum can be obtained from liquid, solid and even gaseous samples. Raman spectroscopy is a suitable non-invasive method for determination of solid-state properties and for chemical identification, for example, detecting changes in polymorphic form. Raman spectroscopy encompasses many methodologies, including backscattering, transmittance, resonance Raman (RR) spectroscopy, surface-enhanced Raman spectroscopy (SERS), tip-enhanced Raman spectroscopy (TERS), spatially offset Raman spectroscopy (SORS), Raman optical activity (ROA), coherent anti-Stokes Raman spectroscopy (CARS), stimulated Raman spectroscopy (SRS) and confocal Raman (CF) spectroscopy. It also lends itself to imaging techniques.
Raman spectroscopy is complementary to infrared spectroscopy. Both techniques probe the fundamental molecular vibrations in a material. However, Raman and infrared spectroscopy have different sensitivities for different functional groups within a material. Raman spectroscopy is particularly useful in examining non-polar bonds, functional groups and vibrations that are highly symmetrical (e.g. C-C single or multiple bonds); but is less sensitive to polar bonds (e.g. C=O) and vibrations that are asymmetrical. For example, water, which strongly influences infrared spectra, exhibits weak Raman scattering and therefore has minimal interference on the resulting spectrum. Raman can therefore be used for aqueous solutions.
A major difficulty of Raman spectroscopy is that the material examined or impurities in the material may exhibit fluorescence, which can overcome the Raman signal. Fluorescence may be avoided by choosing a longer excitation wavelength, for example in the near-infrared region.
Raman spectroscopy is a rapid and non-invasive analytical method and can be performed off-line and also at-line, on-line or in-line for process analytical technology (PAT). Raman spectrometers can be situated at a great distance from the point of measurement when using long-distance optical fibres for sample interfacing. Raman spectroscopy has a wide variety of applications for chemical, physical and process analysis and can also be used for counterfeit detection and quality control, for example:
APPARATUS
There are different types of spectrometers for recording Raman spectra, the most common are benchtop dispersive instruments, including microscope-coupled Raman spectrometers, Fourier transform (FT) and hand-held Raman spectrometers.
Raman spectrometers typically consist of the following components:
PREPARATION OF THE SAMPLE
Raman spectra can be obtained from solids, liquids and gases either directly or in suitable containers such as glass vials, generally without prior sample preparation or dilution.
When using Raman spectroscopy, the measured sample area and volume may be small (in particular for microscope-coupled devices) and care must be taken to ensure the measurement is representative. This can be achieved by, for example, rotation of the sample, performing multiple measurements on different preparations of the sample, increasing the area of illumination by reducing the magnification (focus), by demagnification (defocusing) of the laser beam or by changing the focal length between measurements to scan at different depths.
It is not always possible to consider Raman as a non-destructive technique. The energy transmitted by the laser depends on the duration of exposure and the wavelength. It may change the physical state and may destroy the sample.
CONTROL OF INSTRUMENT PERFORMANCE
Carry out the prescribed calibrations and/or system performance tests according to the manufacturer’s instructions at regular intervals, depending on the use of the apparatus. Wavenumber calibration of Fourier transform systems is maintained with an internal laser (He-Ne). For dispersive systems, emission spectra of a low pressure lamp exhibiting characteristic maxima at wavenumbers over the whole spectral range of the instrument can usually be used for calibration (e. g. neon lamps or less frequently mercury, argon, krypton or xenon lamps).
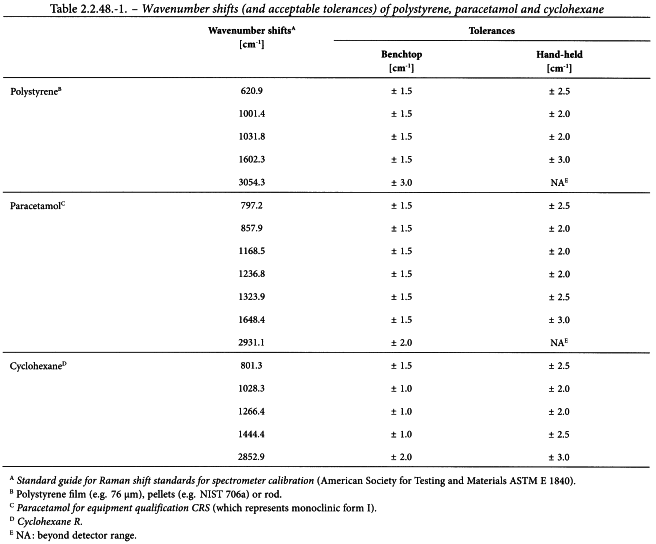
Verification of the wavenumber scale Verify the wavenumber scale of the Raman shift using a suitable standard that has characteristic maxima at the wavenumbers under investigation, for example an organic substance such as polystyrene, paracetamol or cyclohexane (see Table 2.2.48.-1).
A minimum of 3 wavenumber shifts covering the working range of the instrument intended for measurements should be chosen. For dispersive Raman spectrometers that use multiple gratings for different spectral resolutions, the wavenumber scale should be verified at the same optical resolution that will occur for sample collection. All gratings used for Raman measurements should be verified for accuracy of Raman-shift.
Verification of the response-intensity scale The absolute and relative intensities of the Raman bands are affected by variations in several factors including:
Appropriate acceptance criteria will vary with the application but a day-to-day variation of ± 10 per cent or less in relative band intensities is achievable in most cases. Response calibration may involve the use of white-light standards or luminescent glass (e.g. NIST SRM 2241), usually applied by the manufacturer of Raman spectrometers.
QUALITATIVE METHODS
Since the frequency shift position is employed for identification, identical laser intensity for both the reference standard and the material to be examined may not be necessary. The material to be examined is measured in the same physical state (e.g. liquid, solid) as the reference or library material. Raman techniques offer the advantage of non-invasive measurements of the material to be examined without removal from the packaging. However, some packaging materials may alter the measurement. This is especially the case when the packaging absorbs at the laser’s excitation wavelength.
Identification using a reference standard Prepare the material to be examined and the reference standard by the same procedure and record the spectra under the same instrumental conditions. The maxima in the spectrum obtained with the material to be examined correspond in position and if applicable in relative intensity to those in the spectrum obtained with the reference standard. When the spectra recorded in the solid state show differences in the positions of the maxima, treat the material to be examined and the reference standard in the same manner so that they crystallise or are produced in the same solid form, or proceed as described in the monograph, then record the spectra.
Identification using a spectral reference library Record the spectra of a suitable number of materials which exhibit typical variation (manufacturer, batch, particle size, impurity profile, etc.) and comply with the requirements of the monograph or established specifications. The number and selection of samples in the database depends on the specific application. A suitable mathematical transformation of the Raman spectrum may facilitate qualitative comparison of spectra (e.g. baseline correction, min-max normalisation, vector normalisation, derivatives). The selectivity of the database that makes it possible to identify a given material and distinguish it adequately from other materials in the database is to be confirmed during the validation procedure.
QUANTITATIVE METHODS
Quantitative determination requires that the reference standard and the material to be examined are measured at the same laser intensity and frequency. Ensure the material to be examined is measured in the same physical state (e.g. liquid, solid) and concentration range as the reference standard used for calibration. While Beer-Lambert’s law is not valid for Raman spectroscopy, Raman intensity is directly proportional to the concentration of the Raman scattering analytes, however for solid samples and suspensions the Raman intensity could be affected by the matrix (e.g. fluorescence and self-absorption). The Raman signal is influenced by the refractive index of the material, the particle size and the particle-size distribution (where the small particles give a relatively more intense Raman scattering than large particles), the packing density, the scattering cross-section, the absorption cross-section, etc. (see also under Verification of the response-intensity scale).