Appendix XVII Q. Characterisation of Crystalline and Partially Crystalline Solids by X-ray Powder Diffraction (XRPD)
Every crystalline phase of a given substance produces a characteristic X-ray diffraction pattern.
Diffraction patterns can be obtained from a randomly oriented crystalline powder composed of crystallites or crystal fragments of finite size. Essentially 3 types of information can be derived from a powder diffraction pattern: angular position of diffraction lines (depending on geometry and size of the unit cell); intensities of diffraction lines (depending mainly on atom type and arrangement, and particle orientation within the sample); and diffraction line profiles (depending on instrumental resolution, crystallite size, strain and specimen thickness).
Experiments giving angular positions and intensities of lines can be used for applications such as qualitative phase analysis (for example, identification of crystalline phases) and quantitative phase analysis of crystalline materials. An estimate of the amorphous and crystalline fractions1 can also be made.
The X-ray powder diffraction (XRPD) method provides an advantage over other means of analysis in that it is usually non-destructive in nature (specimen preparation is usually limited to grinding to ensure a randomly oriented sample). XRPD investigations can also be carried out under in situ conditions on specimens exposed to non-ambient conditions, such as low or high temperature and humidity.
PRINCIPLE
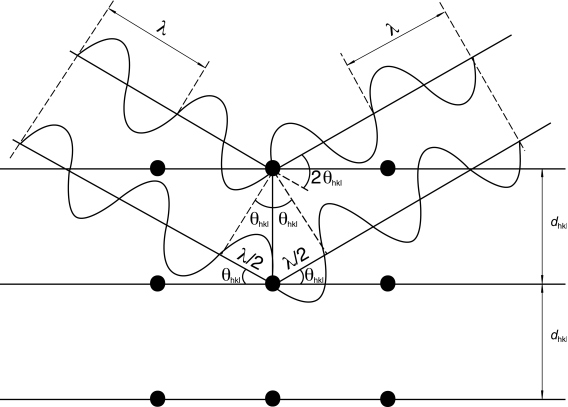
X-ray diffraction results from the interaction between X-rays and electron clouds of atoms. Depending on the atomic arrangement, interferences arise from the scattered X-rays. These interferences are constructive when the path difference between 2 diffracted X-ray waves differs by an integral number of wavelengths. This selective condition is described by the Bragg equation, also called Bragg′s law (see Figure 2.9.33.-1):

The wavelength λ of the X-rays is of the same order of magnitude as the distance between successive crystal lattice planes, or dhkl (also called ‘d-spacings’). θhkl is the angle between the incident ray and the family of lattice planes, and sinθhkl is inversely proportional to the distance between successive crystal planes or d-spacings.
The direction and spacing of the planes with reference to the unit cell axes are defined by the Miller indices {hkl}. These indices are the reciprocals, reduced to the next-lower integer, of the intercepts that a plane makes with the unit cell axes. The unit cell dimensions are given by the spacings a, b and c and the angles between them, α, β, and γ.
The interplanar spacing for a specified set of parallel hkl planes is denoted by dhkl. Each such family of planes may show higher orders of diffraction where the d values for the related families of planes nh, nk, nl are diminished by the factor 1/n (n being an integer: 2, 3, 4, etc.).
Every set of planes throughout a crystal has a corresponding Bragg diffraction angle, θhkl, associated with it (for a specific wavelength λ).
A powder specimen is assumed to be polycrystalline so that at any angle θhkl there are always crystallites in an orientation allowing diffraction according to Bragg′s law(1). For a given X-ray wavelength, the positions of the diffraction peaks (also referred to as ‘lines’, ‘reflections’ or ‘Bragg reflections’) are characteristic of the crystal lattice (d-spacings), their theoretical intensities depend on the crystallographic unit cell content (nature and positions of atoms), and the line profiles on the perfection and extent of the crystal lattice. Under these conditions the diffraction peak has a finite intensity arising from atomic arrangement, type of atoms, thermal motion and structural imperfections, as well as from instrument characteristics.
The intensity is dependent upon many factors such as structure factor, temperature factor, crystallinity, polarisation factor, multiplicity and Lorentz factor.
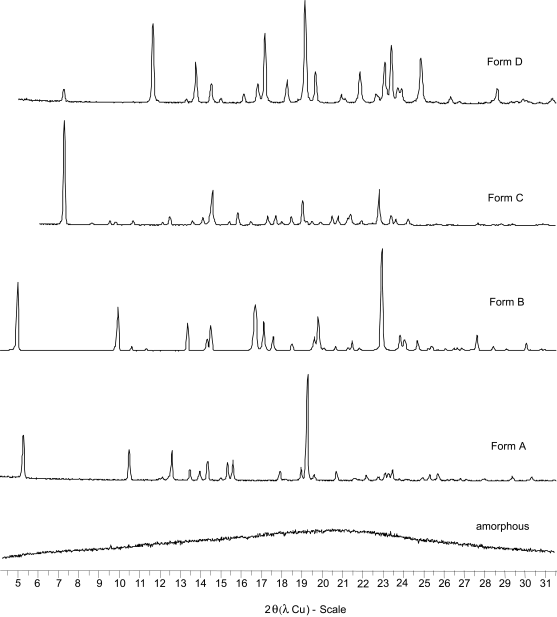
The main characteristics of diffraction line profiles are 2θ position, peak height, peak area and shape (characterised by, for example, peak width or asymmetry, analytical function, empirical representation). An example of the type of powder patterns obtained for 5 different solid phases of a substance are shown in Figure 2.9.33.-2.
In addition to the diffraction peaks, an X-ray diffraction experiment also generates a more-or-less uniform background, upon which the peaks are superimposed. Besides specimen preparation, other factors contribute to the background, for instance the sample holder, diffuse scattering from air and equipment, other instrumental parameters such as detector noise, general radiation from the X-ray tube, etc. The peak-to-background ratio can be increased by minimising background and by choosing prolonged exposure times.
instrument
Instrument set-up
X-ray diffraction experiments are usually performed using powder diffractometers or powder cameras.
A powder diffractometer generally comprises 5 main parts: an X-ray source; incident beam optics, which may perform monochromatisation, filtering, collimation and/or focusing of the beam; a goniometer; diffraction beam optics, which may perform monochromatisation, filtering, collimation and focusing or parallelising of the beam; and a detector. Data-collection and data-processing systems are also required and are generally included in current diffraction measurement equipment.
Depending on the type of analysis to be performed (phase identification, quantitative analysis, lattice parameters determination, etc.), different XRPD instrument configurations and performance levels are required. The simplest instruments used to measure XRPD patterns are powder cameras. The replacement of photographic film as the detection method by photon detectors has led to the design of diffractometers in which the geometric arrangement of the optics is not truly focusing but parafocusing, such as in the Bragg-Brentano geometry. The Bragg-Brentano parafocusing configuration is currently the most widely used and is therefore briefly described here.
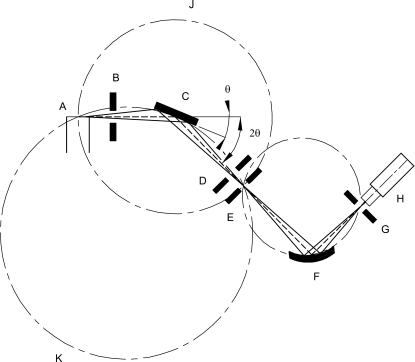
| A. X-ray tube | C. sample | E. receiving slit | G. detector receiving slit | J. diffractometer circle | ||
| B. divergence slit | D. anti-diffusion slit | F. monochromator | H. detector | K. focusing circle |
A given instrument may provide a horizontal or vertical θ/2θ geometry or a vertical θ/θ geometry. For both geometries, the incident X-ray beam forms an angleθ with the specimen surface plane and the diffracted X-ray beam forms an angle 2θ with the direction of the incident X-ray beam (an angleθ with the specimen surface plane). The basic geometric arrangement is represented in Figure 2.9.33.-3. The divergent beam of radiation from the X-ray tube (the so-called ‘primary beam’) passes through the parallel plate collimators and a divergence slit assembly and illuminates the flat surface of the specimen. All the rays diffracted by suitably oriented crystallites in the specimen at an angle 2θ converge to a line at the receiving slit. A second set of parallel plate collimators and a scatter slit may be placed either behind or before the receiving slit. The axes of the line focus and of the receiving slit are at equal distances from the axis of the goniometer. The X-ray quanta are counted by a radiation detector, usually a scintillation counter, a sealed-gas proportional counter, or a position-sensitive solid-state detector such as imaging plate or CCD detector. The receiving slit assembly and the detector are coupled together and move tangentially to the focusing circle. For θ/2θ scans the goniometer rotates the specimen about the same axis as that of the detector, but at half the rotational speed, in a θ/2θ motion. The surface of the specimen thus remains tangential to the focusing circle. The parallel plate collimator limits the axial divergence of the beam and hence partially controls the shape of the diffracted line profile.
A diffractometer may also be used in transmission mode. The advantage with this technology is to lessen the effects due to preferred orientation. A capillary of about 0.5-2 mm thickness can also be used for small sample amounts.
X-ray radiation
In the laboratory, X-rays are obtained by bombarding a metal anode with electrons emitted by the thermionic effect and accelerated in a strong electric field (using a high-voltage generator). Most of the kinetic energy of the electrons is converted to heat, which limits the power of the tubes and requires efficient anode cooling. A 20- to 30-fold increase in brilliance can be obtained using rotating anodes and by using X-ray optics. Alternatively, X-ray photons may be produced in a large-scale facility (synchrotron).
The spectrum emitted by an X-ray tube operating at sufficient voltage consists of a continuous background of polychromatic radiation and additional characteristic radiation that depends on the type of anode. Only this characteristic radiation is used in X-ray diffraction experiments. The principal radiation sources utilised for X-ray diffraction are vacuum tubes utilising copper, molybdenum, iron, cobalt or chromium as anodes; copper, molybdenum or cobalt X-rays are employed most commonly for organic substances (the use of cobalt anodes can be especially preferred to separate distinct X-ray lines). The choice of radiation to be used depends on the absorption characteristics of the specimen and possible fluorescence by atoms present in the specimen. The wavelengths used in powder diffraction generally correspond to the Kα radiation from the anode. Consequently, it is advantageous to make the X-ray beam ‘monochromatic’ by eliminating all the other components of the emission spectrum. This can be partly obtained using Kβ filters, i.e. metal filters selected as having an absorption edge between the Kα and Kβ wavelengths emitted by the tube.
Such a filter is usually inserted between the X-ray tube and the specimen. Another, more-and-more-commonly used way to obtain a monochromatic X-ray beam is via a large monochromator crystal (usually referred to as a ‘monochromator’). This crystal is placed before or behind the specimen and diffracts the different characteristic peaks of the X-ray beam (i.e. Kα and Kβ) at different angles, so that only one of them may be selected to enter into the detector. It is even possible to separate Kα1 and Kα2 radiations by using a specialised monochromator. Unfortunately, the gain in getting a monochromatic beam by using a filter or a monochromator is counteracted by a loss in intensity. Another way of separating Kα and Kβ wavelengths is by using curved X-rays mirrors that can simultaneously monochromate and focus or parallelise the X-ray beam.
RADIATION PROTECTION. Exposure of any part of the human body to X-rays can be injurious to health. It is therefore essential that whenever X-ray equipment is used, adequate precautions are taken to protect the operator and any other person in the vicinity. Recommended practice for radiation protection as well as limits for the levels of X-radiation exposure are those established by national legislation in each country. If there are no official regulations or recommendations in a country, the latest recommendations of the International Commission on Radiological Protection should be applied.
SPECIMEN PREPARATION AND MOUNTING
The preparation of the powdered material and mounting of the specimen in a suitable holder are critical steps in many analytical methods, and are particularly so for XRPD analysis, since they can greatly affect the quality of the data to be collected(1). The main sources of error due to specimen preparation and mounting are briefly discussed here for instruments in Bragg-Brentano parafocusing geometry.
Specimen preparation
In general, the morphology of many crystalline particles tends to give a specimen that exhibits some degree of preferred orientation in the specimen holder. This is particularly evident for needle-like or plate-like crystals when size reduction yields finer needles or platelets. Preferred orientation in the specimen influences the intensities of various reflections, so that some are more intense and others are less intense, compared to what would be expected from a completely random specimen. Several techniques can be employed to improve randomness in the orientation of crystallites (and therefore to minimise preferred orientation), but further reduction of particle size is often the best and simplest approach. The optimum number of crystallites depends on the diffractometer geometry, the required resolution and the specimen attenuation of the X-ray beam. In some cases, particle sizes as large as 50 µm will provide satisfactory results in phase identification. However, excessive milling (crystallite sizes less than approximately 0.5 µm) may cause line broadening and significant changes to the sample itself such as:
Therefore, it is advisable to compare the diffraction pattern of the non-ground specimen with that corresponding to a specimen of smaller particle size (e.g. a milled specimen). If the XRPD pattern obtained is of adequate quality considering its intended use, then grinding may not be required.
It should be noted that if a sample contains more than one phase and if sieving is used to isolate particles to a specific size, the initial composition may be altered.
Specimen mounting
Effect of specimen displacement
A specimen surface that is offset by D with reference to the diffractometer rotation axis causes systematic errors that are very difficult to avoid entirely; for the reflection mode, this results in absolute D⋅cosθ shifts(1) in 2θ positions (typically of the order of 0.01° in 2θ at low angles (cosθ ≃ 1) for a displacement D = 15 µm) and asymmetric broadening of the profile towards low 2θ values. Use of an appropriate internal standard allows the detection and correction of this effect simultaneously with that arising from specimen transparency. This is by far the largest source of errors in data collected on well-aligned diffractometers.
Effect of specimen thickness and transparency
When the XRPD method in reflection mode is applied, it is often preferable to work with specimens of ‘infinite thickness’. To minimise the transparency effect, it is advisable to use a non-diffracting substrate (zero background holder), for example a plate of single crystalline silicon cut parallel to the 510 lattice planes(1). One advantage of the transmission mode is that problems with sample height and specimen transparency are less important. The use of an appropriate internal standard allows the detection and correction of this effect simultaneously with that arising from specimen displacement.
control of the instrument performance
Goniometers and the corresponding incident and diffracted X-ray beam optics have many mechanical parts that need adjustment. The degree of alignment or misalignment directly influences the quality of the results of an XRPD investigation. Therefore, the different components of the diffractometer must be carefully adjusted (optical and mechanical systems, etc.) to minimise adequately systematic errors, while optimising the intensities received by the detector. The search for maximum intensity and maximum resolution is always antagonistic when aligning a diffractometer. Hence, the best compromise must be sought whilst performing the alignment procedure. There are many different configurations and each supplier’s equipment requires specific alignment procedures.
The overall diffractometer performance must be tested and monitored periodically using suitable certified reference materials. Depending on the type of analysis, other well-defined reference materials may also be employed, although the use of certified reference materials is preferred.
QUALITATIVE PHASE ANALYSIS (IDENTIFICATION OF PHASES)
The identification of the phase composition of an unknown sample by XRPD is usually based on the visual or computer-assisted comparison of a portion of its XRPD pattern to the experimental or calculated pattern of a reference material. Ideally, these reference patterns are collected on well-characterised single-phase specimens. This approach makes it possible in most cases to identify a crystalline substance by its 2θ diffraction angles or d-spacings and by its relative intensities. The computer-aided comparison of the diffraction pattern of the unknown sample to the comparison data can be based either on a more-or-less extended 2θ-range of the whole diffraction pattern or on a set of reduced data derived from the pattern. For example, the list of d-spacings and normalised intensities (Inorm), a so-called (d, Inorm)-list extracted from the pattern, is the crystallographic fingerprint of the material, and can be compared to (d, Inorm)-lists of single-phase samples compiled in databases.
For most organic crystals, when using Cu Kα radiation, it is appropriate to record the diffraction pattern in a 2θ-range from as near 0° as possible to at least 40°. The agreement in the 2θ-diffraction angles between specimen and reference is within 0.2° for the same crystal form, while relative intensities between specimen and reference may vary considerably due to preferred orientation effects. By their very nature, variable hydrates and solvates are recognised to have varying unit cell dimensions and as such shifting occurs in peak positions of the measured XRPD patterns for these materials. In these unique materials, variance in 2θ-positions of greater than 0.2° is not unexpected. As such, peak position variances such as 0.2° are not applicable to these materials. For other types of samples (e.g. inorganic salts), it may be necessary to extend the 2θ-region scanned to well beyond 40°. It is generally sufficient to scan past the 10 strongest reflections identified in single phase XRPD database files.
It is sometimes difficult or even impossible to identify phases in the following cases:
QUANTITATIVE PHASE ANALYSIS
If the sample under investigation is a mixture of 2 or more known phases, of which not more than 1 is amorphous, the percentage (by volume or by mass) of each crystalline phase and of the amorphous phase can, in many cases, be determined. Quantitative phase analysis can be based on the integrated intensities, on the peak heights of several individual diffraction lines(1), or on the full pattern. These integrated intensities, peak heights or full-pattern data points are compared to the corresponding values of reference materials. These reference materials shall be single-phase or a mixture of known phases. The difficulties encountered during quantitative analysis are due to specimen preparation (the accuracy and precision of the results require in particular homogeneity of all phases and a suitable particle size distribution in each phase) and to matrix effects. In favourable cases, amounts of crystalline phases as small as 10 per cent may be determined in solid matrices.
Polymorphic samples
For a sample composed of 2 polymorphic phases a and b, the following expression may be used to quantify the fraction Fa of phase a:
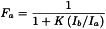
The fraction is derived by measuring the intensity ratio between the 2 phases, knowing the value of the constant K. K is the ratio of the absolute intensities of the 2 pure polymorphic phases Ioa/Iob. Its value can be determined by measuring standard samples.
Methods using a standard
The most commonly used methods for quantitative analysis are:
The ‘external standard method’ is the most general method and consists of comparing the X-ray diffraction pattern of the mixture, or the respective line intensities, with those measured in a reference mixture or with the theoretical intensities of a structural model, if it is fully known.
To limit errors due to matrix effects, an internal reference material with crystallite size and X-ray absorption coefficient comparable to those of the components of the sample, and with a diffraction pattern that does not overlap at all that of the sample to be analysed, can be used. A known quantity of this reference material is added to the sample to be analysed and to each of the reference mixtures. Under these conditions, a linear relationship between line intensity and concentration exists. This application, called the ‘internal standard method’, requires a precise measurement of diffraction intensities.
In the ‘spiking method’ (or ‘standard addition method’), some of the pure phase a is added to the mixture containing the unknown concentration of a. Multiple additions are made to prepare an intensity-versus-concentration plot in which the negative x intercept is the concentration of the phase a in the original sample.
ESTIMATE OF THE AMORPHOUS AND CRYSTALLINE FRACTIONS
In a mixture of crystalline and amorphous phases, the crystalline and amorphous fractions can be estimated in several ways. The choice of the method used depends on the nature of the sample:
| A | = | total area of the peaks arising from diffraction from the crystalline fraction of the sample; |
| B | = | total area below area A; |
| C | = | background area (due to air scattering, fluorescence, equipment, etc). |
When these areas have been measured, the degree of crystallinity can be roughly estimated using the following formula:

It is noteworthy that this method does not yield absolute degree-of-crystallinity values and hence is generally used for comparative purposes only.
More sophisticated methods are also available, such as the Ruland method.
single crystal structure
In general, the determination of crystal structures is performed from X-ray diffraction data obtained using single crystals. However, crystal structure analysis of organic crystals is a challenging task, since the lattice parameters are comparatively large, the symmetry is low and the scattering properties are normally very low.
For any given crystalline form of a substance, knowledge of the crystal structure allows the calculation of the corresponding XRPD pattern, thereby providing a ‘preferred-orientation-free’ reference XRPD pattern, which may be used for phase identification.