|
|
|
|
|
|
|
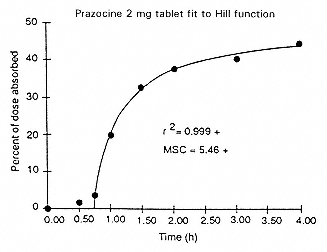
Fig. 18
Drug absorption data fit to the Hill Function. |
|
|
|
|
|
|
|
|
not very useful information. Looking at Fig. 19, it should be apparent that there is a significant difference between the Theo-Dur product and the Theo-24 product. But just how is that difference quantified? |
|
|
|
|
|
|
|
|
Using the Makoid-Banakar function, quantifiable differences become readily apparent. Looking at Table 6, which contains the parameters and results of statistical best fit analyses of the two release profiles, we see that |
|
|
|
|
|
|
|
|
1. The Fraction Released Immediately (FRI) is 0 for Theo-24 and about 25% for the Theo-Dur, |
|
|
|
|
|
|
|
|
2. The initial zero-order release rate constant (B) for Theo-Dur is about twice as fast as Theo-24, |
|
|
|
|
|
|
|
|
3. The first-order shut-down rate constant (C) for Theo-Dur is about two to three times larger than Theo-24, yielding a peak-time (TMAX = 1/C) two to three times sooner, and |
|
|
|
|
|
|
|
|
4. The fraction released at infinite time [FMAX = B/C×EXP(-1)] is also easily obtained. |
|
|
|
|
|
|
|
|
In addition, other relationships become apparent when the data is subject to this type of analysis. It might even be possible to quantitate the effects of experimental conditions on the release profiles by this method. For example, a series of graphs of the release profiles of Theo-24 at various RPM showed what could be a difference in the profiles depending on the angular velocity. |
|
|
|
|
|