|
|
|
|
|
|
|
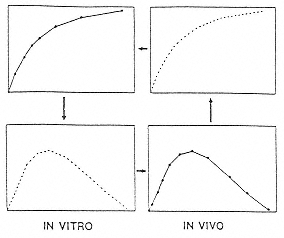
Fig. 29
Analogous data for in vitro-in vivo correlations.
Measured data (- -); calculated data () [from
Proc. Pharm. Tech. Conf., 1992, p. 162.] |
|
|
|
|
|
|
|
|
MRT and MDT, Kdiss.in vitro and Kdiss. in vivo Fin vivo and Fin vitro (Table 8). The resultant correlations are more meaningful and dependable. |
|
|
|
|
|
|
|
|
C. System Response Correlation Concept |
|
|
|
|
|
|
|
|
The evolution of microcomputers and analytical software has resulted in the availability of phenomenal tools for the pharmaceutical researcher. When analysis was done mostly by hand, correlations were, per force, point, a single number derived from one graph compared to a single number derived from a second, |
|
|
|
|
| Table 8 Parameters Employed in In Vitro-In Vivo Correlation Determinations | | In Vitro | | | AUC | AUC | | Kr, Kd | Ka, Kd, Kr | T' , Tmax , Tmax | Cmax | | F(t), T(F), t63.2% | Fa(t), T(Fa) | | MDT | MRT |
|
|
|