Appendix II A. Infrared Spectrophotometry
Infrared spectrophotometers are used for recording spectra in the region of 4000-650 cm-1 (2.5-15.4 µm) or in some cases down to 200 cm-1 (50 µm).
apparatus
Spectrophotometers for recording spectra consist of a suitable light source, monochromator or interferometer and detector.
Fourier transform spectrophotometers use polychromatic radiation and calculate the spectrum in the frequency domain from the original data by Fourier transformation. Spectrophotometers fitted with an optical system capable of producing monochromatic radiation in the measurement region may also be used. Normally the spectrum is given as a function of transmittance, the quotient of the intensity of the transmitted radiation and the incident radiation. It may also be given in absorbance.
The absorbance (A) is defined as the logarithm to base 10 of the reciprocal of the transmittance (T):
T | = |
|
I0 | = | intensity of incident radiation, |
I | = | intensity of transmitted radiation. |

PREPARATION OF THE SAMPLE
For recording by transmission or absorption
Prepare the substance by one of the following methods.
Liquids
Examine a liquid either in the form of a film between 2 plates transparent to infrared radiation, or in a cell of suitable path length, also transparent to infrared radiation.
Liquids or solids in solution
Prepare a solution in a suitable solvent. Choose a concentration and a path length of the cell which give a satisfactory spectrum. Generally, good results are obtained with concentrations of 10-100 g/L for a path length of 0.5-0.1 mm. Absorption due to the solvent is compensated by placing in the reference beam a similar cell containing the solvent used. If an FT-IR instrument is used, the absorption is compensated by recording the spectra for the solvent and the sample successively. The solvent absorbance, corrected by a compensation factor, is subtracted using calculation software.
Solids
Examine solids dispersed in a suitable liquid (mull) or in a solid (halide disc), as appropriate. If prescribed in the monograph, make a film of a molten mass between 2 plates transparent to infrared radiation.
Triturate a small quantity of the substance to be examined with the minimum quantity of liquid paraffin R or other suitable liquid; 5-10 mg of the substance to be examined is usually sufficient to make an adequate mull using one drop of liquid paraffin R. Compress the mull between 2 plates transparent to infrared radiation.
Triturate 1-2 mg of the substance to be examined with 300-400 mg, unless otherwise specified, of finely powdered and dried potassium bromide R or potassium chloride R. These quantities are usually sufficient to give a disc of 10-15 mm diameter and a spectrum of suitable intensity. If the substance is a hydrochloride, it is recommended to use potassium chloride R. Carefully grind the mixture, spread it uniformly in a suitable die, and submit it to a pressure of about 800 MPa (8 t⋅cm-2). For substances that are unstable under normal atmospheric conditions or are hygroscopic, the disc is pressed in vacuo. Several factors may cause the formation of faulty discs, such as insufficient or excessive grinding, humidity or other impurities in the dispersion medium or an insufficient reduction of particle size. A disc is rejected if visual examination shows lack of uniform transparency or when transmittance at about 2000 cm-1 (5 µm) in the absence of a specific absorption band is less than 60 per cent without compensation, unless otherwise prescribed.
Gases
Examine gases in a cell transparent to infrared radiation and having an optical path length of about 100 mm. Evacuate the cell and fill to the desired pressure through a stopcock or needle valve using a suitable gas transfer line between the cell and the container of the gas to be examined.
If necessary adjust the pressure in the cell to atmospheric pressure using a gas transparent to infrared radiation (for example nitrogen R and argon R). To avoid absorption interferences due to water, carbon dioxide or other atmospheric gases, place in the reference beam, if possible, an identical cell that is either evacuated or filled with the gas transparent to infrared radiation.
for recording by diffuse reflectance
Solids
Triturate a mixture of the substance to be examined with finely powdered and dried potassium bromide R or potassium chloride R. Use a mixture containing approximately 5 per cent of the substance, unless otherwise specified. Grind the mixture, place it in a sample cup and examine the reflectance spectrum.
The spectrum of the sample in absorbance mode may be obtained after mathematical treatment of the spectra by the Kubelka-Munk function.
For recording by attenuated total reflection
Attenuated total reflection (including multiple reflection) involves light being reflected internally by a transmitting medium, typically for a number of reflections. However, several accessories exist where only one reflection occurs.
Prepare the substance as follows. Place the substance to be examined in close contact with an internal reflection element (IRE) such as diamond, germanium, zinc selenide, thallium bromide-thallium iodide (KRS-5) or another suitable material of high refractive index. Ensure close and uniform contact between the substance and the whole crystal surface of the internal reflection element, either by applying pressure or by dissolving the substance in an appropriate solvent, then covering the IRE with the obtained solution and evaporating to dryness. Examine the attenuated total reflectance (ATR) spectrum.
IDENTIFICATION USING REFERENCE SUBSTANCES
Prepare the substance to be examined and the reference substance by the same procedure and record the spectra between 4000-650 cm-1 (2.5-15.4 µm) under the same operational conditions. The transmission minima (absorption maxima) in the spectrum obtained with the substance to be examined correspond in position and relative size to those in the spectrum obtained with the reference substance (CRS).
When the spectra recorded in the solid state show differences in the positions of the transmission minima (absorption maxima), treat the substance to be examined and the reference substance in the same manner so that they crystallise or are produced in the same form, or proceed as prescribed in the monograph, then record the spectra.
IDENTIFICATION USING REFERENCE SPECTRA
Control of resolution performance
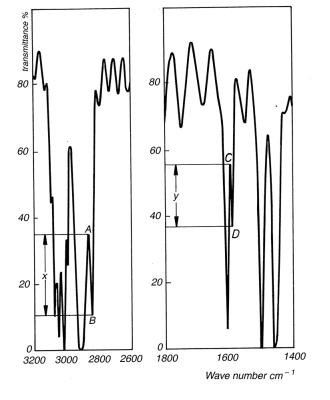
For instruments having a monochromator, record the spectrum of a polystyrene film approximately 35 µm in thickness. The difference x (see Figure 2.2.24.-1) between the percentage transmittance at the transmission maximum A at 2870 cm-1 (3.48 µm) and that at the transmission minimum B at 2849.5 cm-1 (3.51 µm) must be greater than 18. The difference y between the percentage transmittance at the transmission maximum C at 1589 cm-1 (6.29 µm) and that at the transmission minimum D at 1583 cm-1 (6.32 µm) must be greater than 10.
For Fourier-transform instruments, use suitable instrument resolution with the appropriate apodisation prescribed by the manufacturer. The resolution is checked by suitable means, for example by recording the spectrum of a polystyrene film approximately 35 µm in thickness. The difference between the absorbances at the absorption minimum at 2870 cm-1 and the absorption maximum at 2849.5 cm-1 is greater than 0.33. The difference between the absorbances at the absorption minimum at 1589 cm-1 and the absorption maximum at 1583 cm-1 is greater than 0.08.
Verification of the wave-number scale
The wave-number scale may be verified using a polystyrene film, which has transmission minima (absorption maxima) at the wave numbers (in cm–1) shown in Table 2.2.24.-1.

Method
Prepare the substance to be examined according to the instructions accompanying the reference spectrum/reference substance. Using the operating conditions that were used to obtain the reference spectrum, which will usually be the same as those for verifying the resolution performance, record the spectrum of the substance to be examined.
The positions and the relative sizes of the bands in the spectrum of the substance to be examined and the reference spectrum are concordant in the 2 spectra.
Compensation for water vapour and atmospheric carbon dioxide
For Fourier-transform instruments, spectral interference from water vapour and carbon dioxide is compensated using suitable algorithms according to the manufacturer′s instructions. Alternatively, spectra can be acquired using suitable purged instruments or ensuring that sample and background single beam spectra are acquired under exactly the same conditions.
IMPURITIES IN GASES
For the analysis of impurities, use a cell transparent to infrared radiation and of suitable optical path length (for example, 1-20 m). Fill the cell as prescribed under Gases. For detection and quantification of the impurities, proceed as prescribed in the monograph.
Near-infrared spectrophotometry
Near-infrared (NIR) spectroscopy is a technique with wide and varied applications in pharmaceutical analysis. The NIR spectral range extends from 780 nm to 2500 nm (from 12 800 cm-1 to 4000 cm-1). NIR spectra are dominated by C-H, N-H, O-H and S-H overtones and combinations of fundamental mid-infrared (MIR) vibrations. They contain composite chemical and physical information and in most cases this information can be extracted by suitable mathematical data treatment. NIR bands are much weaker than the fundamental MIR vibrations from which they originate. Because absorptivities in the NIR range are low, radiation can penetrate up to several millimetres into materials, including solids. Furthermore, many materials such as glass are relatively transparent in this region.
Measurements can be made directly in situ, in addition to standard sampling and testing procedures. NIR measurements can be performed off-line, and also at-line or in-line, and on-line for process analytical technology (PAT). Suitable chemometric methods may be required for identification. However, when the specificity criteria for a qualitative method are met, chemical identification or solid-state characterisation is possible by direct comparison of the untreated or pre-treated spectra obtained with the chemical substance being examined with a spectrum of a reference substance.
NIR spectroscopy has a wide variety of applications for chemical, physical and process analysis, for example:
Measurements in the NIR region are influenced by many chemical and physical factors as described below; the reproducibility and relevance of results depend on control of these factors and measurements are usually valid only for a defined calibration model.
APPARATUS
All NIR measurements are based on passing light through or into a sample and measuring the attenuation of the emerging (transmitted or reflected) beam. Spectrometers for measurement in the NIR region consist of a suitable light source (such as a highly-stable quartz-tungsten lamp), a monochromator or interferometer, and a detector. Common monochromators are acousto-optic tunable filters (AOTF), gratings or prisms. Traditionally, many NIR instruments have a single-beam design, though some process instruments use internal referencing and can therefore be dual-beam (for example in diode array instruments). Silicon, lead sulfide, and indium gallium arsenide are examples of detector materials. Conventional cuvette sample holders, fibre-optic probes, transmission dip cells, neutral borosilicate vials and spinning or traversing sample holders are a few examples of sampling devices. The selection is based on the intended application, paying particular attention to the suitability of the sampling system for the type of sample to be analysed. Suitable data processing and evaluation units (e.g. software and computer) are usually part of the system.
It is common to express the wavelength (λ) in nanometres and the wavenumber (v) in reciprocal centimetres (cm-1), depending on the measurement technique and apparatus. Conversion between nm and cm-1 is performed according to the following expression:
MEASUREMENT METHODS
Transmission mode
Transmittance (T) is a measure of the decrease in radiation intensity at given wavelengths when radiation is passed through the sample. The sample is placed in the optical beam between the source and the detector. The arrangement is analogous to that in many conventional spectrometers. The resulting spectrum can be presented directly in terms of transmittance (T) and/or absorbance (A) (y-axis) versus the wavelength or wavenumber (x-axis).

I0 | = | intensity of incident radiation; |
I | = | intensity of transmitted radiation; |
Diffuse reflection mode
The diffuse reflection mode gives a measure of reflectance (R), the ratio of the intensity of light reflected from the sample (I) to that reflected from a background or reference reflective surface (Ir). Depending on the chemical composition and physical characteristics of the sample, NIR radiation can penetrate a more or less substantial distance into the sample, where it can be absorbed by the overtones and combinations of the fundamental vibrations of the analyte species present in the sample. Non-absorbed radiation is partially reflected back from the sample to the detector. NIR reflectance spectra are typically obtained by calculating and plotting log10 (1/R) (y-axis) versus the wavelength or wavenumber (x-axis).

I | = | intensity of light diffusively reflected from the sample; |
Ir | = | intensity of light reflected from the background or reference reflective surface; |
Transflection mode
This mode is a combination of transmittance and reflectance. In the measurement of transflectance (T*), a mirror or a diffuse reflectance surface is used to reflect the transmitted radiation back through the sample, thus doubling the pathlength. Non-absorbed radiation is reflected back from the sample to the detector. The resulting spectrum can be presented directly in terms of transflectance (T*) and/or absorbance (A*) (y-axis) versus the wavelength or wavenumber (x-axis).

I | = | intensity of transflected radiation measured from the sample; |
IT | = | intensity of transflected radiation of the reference material as background; |
SAMPLE PREPARATION/PRESENTATION
Sample preparation and presentation may vary according to the measurement mode. The following requirements are necessary for all sampling techniques:
In some process analysis situations it may be impossible to remove a probe for reference background data collection; various options are therefore to be considered, including internal referencing, measurement of a background reference using a 2nd detector, etc. Only spectra measured against a background possessing the same optical properties can be directly compared with one another.
Transmission mode
The measurement of transmittance (T) is dependent on a background transmittance spectrum for its calculation. Examples of background references include air, a polymeric disc, an empty cell, a solvent blank or in special cases a reference sample. The method generally applies to liquids (diluted or undiluted), dispersions, solutions and solids (including tablets and capsules). For transmittance measurements of solids, a suitable sample accessory is used. Liquid samples are examined in a cell of suitable pathlength (typically 0.5-4 mm), transparent to NIR radiation, or alternatively by immersion of a fibre-optic probe of a suitable configuration.
Diffuse reflection mode
This mode generally applies to solids. The sample is examined directly, or in a suitable device (for example a sample holder), or in direct contact with a fibre-optic probe. For process monitoring, material can be analysed through a polished window interface (e.g. sapphire), or using an in-line fibre-optic probe. Care must be taken to ensure that the measuring conditions are as reproducible as possible from one sample to another. The reflected radiation of a background reference is scanned to obtain the baseline, and then the reflectance of one or more analytical samples is measured. Common reflectance references include ceramic, thermoplastic resins and gold. Other suitable materials may be used.
Transflection mode
This mode generally applies to liquids, suspensions and clear plastic materials. A reflector is placed behind the sample so as to double the pathlength. This configuration can be adopted to share the same instrument geometry with reflectance and fibre-optic probe systems where the source and the detector are on the same side of the sample. The sample is examined through a cell with a mirror or a suitable diffusive reflector, made either of metal or of an inert substance (for example, dried titanium dioxide) not absorbing in the NIR region. Liquids can also be measured using in-line transflectance probes.
FACTORS AFFECTING SPECTRAL RESPONSE
Environment
The environment temperature and humidity must be taken into consideration before carrying out measurements.
Sample presentation area
The sample presentation area or probe end must be clean of residue prior to measurement. Similarly, the in-line or on-line interface to the sample should not have significant product or contamination build-up, which would interfere with the desired measurement.
Sample temperature
This parameter is important for aqueous solutions and many liquids, where a difference of a few degrees can result in measurable spectral changes which may have a significant effect on the analysis. Temperature is also an important parameter for solids and powders containing water.
Moisture and solvent residues
Moisture and solvent residues present in the samples will contribute significant absorption bands in the NIR region.
Sample thickness
Sample thickness is a known source of spectral variability and must be assessed and/or controlled, particularly for tablet and capsule analysis in transmittance mode. For the measurement of compressed powders, an infinite thickness is typically reached after 5 mm of sample depth (e.g. in a vial).
Sample optical properties
In solids, both surface and bulk scattering properties of samples must be taken into account. Spectra of physically, chemically or optically heterogeneous samples may require increasing the beam size, or examining multiple samples or spinning the sample to obtain a representative spectrum of the sample. Certain factors such as differing degree of compaction or particle size in powdered materials and surface finish can cause significant spectral differences.
Solid-state forms
Variations in solid-state forms (polymorphs, hydrates, solvates and amorphous forms) influence vibrational spectra. Hence, different crystalline forms as well as the amorphous form of a solid may be distinguished from one another on the basis of their NIR spectra. Where multiple crystalline forms are present, care must be taken to ensure that the calibration samples have a distribution of forms relevant to the intended application.
Age of samples
Samples may exhibit changes in their chemical, physical or optical properties over time. Depending on the storage conditions, solid samples may either absorb or desorb water, and portions of amorphous material may crystallise. Materials used for NIR calibration should be representative of future samples and their matrix variables.
PRE-TREATMENT OF NIR SPECTRAL DATA
In many cases, and particularly for reflection mode spectra, some form of mathematical pre-treatment of the spectrum may be useful prior to the development of a classification or calibration model. The aim can be, for example, to reduce baseline variations, to reduce the impact of known variations that are interfering in the subsequent mathematical models, or to simplify data before use. In some cases spectra may also be normalised or corrected for scatter, for example using standard normal variate (SNV) transformation. Spectral pre-treatment techniques may include, for example, windowing and noise reduction and the numerical calculation of the first- or second-order derivative of the spectrum. Higher-order derivatives are not recommended because of increased spectral noise.
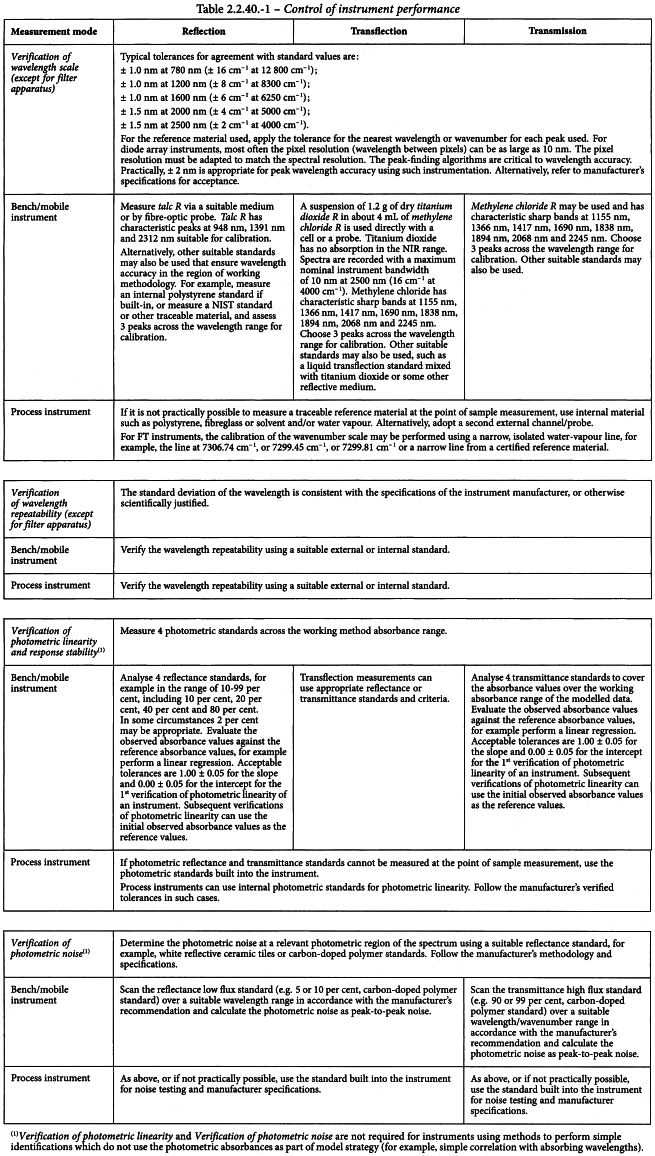
CONTROL OF INSTRUMENT PERFORMANCE
Use the apparatus according to the manufacturer’s instructions and carry out the prescribed verification at regular intervals, according to the use of the apparatus and the application. For in-line and on-line applications, the use of alternative means of control of instrument performance must be scientifically justified. For example, utilise the standards built into the instrument or separate channels/probes to demonstrate instrument performance (pending practicality).
System suitability tests may be required prior to sample scanning, and the instrument attributes with potential impact on suitability of the final measurement (typically photometric noise and wavelength accuracy) must be tested. The frequency at which each performance test is carried out must be risk-assessed depending on the instrument type and its environment. For example, instruments placed in harsh environments with variations in temperature and humidity may need frequent performance testing. Cases where the measurement system cannot be removed such as an in-line probe or flow cell are also to be considered.
Some accessories are custom designed and therefore require adequate performance testing.
Verification and calibration of the wavelength or wavenumber scale (except for filter apparatus) Verify the wavelength scale employed, generally in the region between 780 nm and 2500 nm ( 12 800 cm-1 to 4000 cm-1) or in the intended spectral range using one or more suitable wavelength standards which have characteristic maxima or minima within the wavelength range to be used. For example, methylene chloride R, talc R, wavelength reference lamps or a mixture of rare-earth oxides are suitable reference materials. Other suitable standards may also be used. Obtain a spectrum and measure the position of at least 3 peaks distributed over the range used. For rare-earth oxides, the National Institute of Standards and Technology (NIST) provides suitable reference materials. Fourier transform (FT) instruments have a linear frequency range, therefore wavelength certification at a single frequency is sufficient.
Verification and calibration of photometric linearity The photometric linearity is demonstrated with a set of transmittance or reflectance standards with known percentage values of transmittance or reflectance. For reflectance measurements, carbon-doped polymer standards are available. Ensure that the absorbance of the materials used is relevant to the intended linear working range of the method. Subsequent verifications of photometric linearity can use the initial observed absorbance values as the reference values. Non-linear calibration models and hence non-linear responses are acceptable with understanding demonstrated by the user.
Spectra obtained from reflectance and transmittance standards are subject to variability due to the differences between the experimental conditions under which they were factory-calibrated and those under which they are subsequently put to use. Hence, the percentage reflectance values supplied with a set of calibration standards may not be useful in the attempt to establish an ‘absolute’ calibration for a given instrument. As long as the standards do not change chemically or physically and the same reference background is used as was used to obtain the certified values, subsequent measurements of the same standards under identical conditions, including precise sample positioning, give information on long-term stability of the photometric response. A tolerance of ± 2 per cent of the absorbance value is acceptable for long-term stability; this verification is only necessary if the spectra are used without pre-treatment.
Recommendations for the conditions used to control instrument performance for the various measurement modes are summarised in Table 2.2.40.-1.
QUALITATIVE ANALYSIS (Identification and Characterisation)
Establishment of a spectral reference library
Record the spectra of a suitable number of representative samples of the substance which have known, traceable identities, and that exhibit the variation typical for the substance to be analysed (for example, solid-state form, particle size, etc.). Libraries are built using representative samples under appropriate environmental conditions. The set of spectra obtained represents the information which can be used for identification of the sample to be analysed.
The collection of spectra in the library may be represented in different ways defined by the mathematical technique used for identification. These may be:
The number of substances in the library depends on the specific application. All spectra in the library used have the same:
If sub-groups (sub-libraries) are created, the above criteria are applied independently for each group. Sub-libraries are individually validated. Original spectral data for the preparation of the spectral library must be archived. Caution must be exercised when performing any mathematical transformation, as artefacts can be introduced or essential information (important with qualification methods) can be lost. The suitability of the algorithm used should be demonstrated by successful method validation and in all cases the rationale for the use of transform must be documented.
Direct comparison of substance and reference spectra
Direct comparison of representative spectra of the substance to be examined and of a reference substance for qualitative chemical or physical identification purposes may not require use of a reference spectral library where specificity permits.
Data evaluation
Direct comparison of the representative spectrum of the substance to be examined is made with the individual or mean reference spectra of all substances in the database on the basis of their mathematical correlation or other suitable algorithms. A set of known reference mean spectra and the variability around this mean can be used with an algorithm for classification; alternatively, this can be achieved visually by overlaying spectral data if specificity is inherent. There are different techniques available, such as principal component analysis (PCA), cluster analysis, and soft independent modelling by class analogy (SIMCA). The reliability of the technique chosen for a particular application has to be validated according to the following:
Validation of the model
Identification methods using direct spectral comparison must be validated in accordance with identification method validation procedures.
The validation parameters for qualitative methods are robustness and specificity.
limit analysis
Relative comparison of spectra
A calibration is not required when comparing a set of spectra for limit analysis purposes, such as the maximum or minimum absorbance at which an analyte absorbs. Also, dryer end point control may use a qualitative approach around a specific absorbing wavelength. Appropriate spectral ranges and pre-treatments (if used) must be shown to be fit for purpose.
Specificity
The relative discriminatory power for a limit test must be demonstrated. The extent of specificity testing is dependent on the application and the risks being controlled. Variations in matrix concentrations within the operating range of the method must not affect the measurement.
TREND ANALYSIS
Relative comparison of spectra
A calibration is not necessarily required when comparing a set of spectra for trend analysis purposes, such as the moving block approach to estimate statistical parameters such as mean, median and standard deviation. For example, blend uniformity monitoring using NIR spectroscopy has adopted such data analysis approaches. Appropriate spectral ranges and algorithms must be used for trend analyses.
Specificity
The relative discriminatory power for trend analysis must be demonstrated. The extent of specificity testing is dependent on the application and the risks being controlled. Variations in matrix concentrations within the operating range of the method must not affect the trend analysis.
QUANTITATIVE ANALYSIS
Establishment of a spectral reference library for a calibration model
Calibration is the process of constructing a mathematical model to relate the response from a sample scanned using an analytical instrument to the properties of the samples. Any calibration model that can be clearly defined in a mathematical expression and gives suitable results can be used. Record the spectra of a suitable number of representative samples with known or future-established values of the attribute of interest throughout the range to be measured (for example, content of water). The number of samples for calibration will depend on the complexity of the sample matrix and interferences (e.g. temperature, particle size, etc.). All samples must give quantitative results within a calibration interval as defined by the intended purpose of the method. Multiple linear regression (MLR), principal component regression (PCR) and partial least squares regression (PLS) are commonly used algorithms. For PLS or PCR calibrations, the regression coefficients and/or the loadings should be plotted and the regions of large coefficients or loadings compared with the spectrum of the analyte. Predicted residual error sum of squares (PRESS) plots (or similar) are useful to facilitate the optimising of the number of PCR or PLS factors.
Pre-treatment of data
Wavelength selection or excluding certain wavelength ranges may enhance the accuracy and robustness of calibration models. Wavelength compression (wavelength averaging) techniques may be applied to the data.
Model validation parameters
Analytical performance characteristics to be considered for demonstrating the validation of NIR methods are similar to those required for any analytical procedure. Specific acceptance criteria for each validation parameter must be consistent with the intended use of the method. Validation parameters for quantitative methods are accuracy, linearity, precision (repeatability and intermediate precision), robustness and specificity.
ONGOING MODEL EVALUATION
NIR models validated for use are subjected to ongoing performance evaluation and monitoring of validation parameters.
transfer of databases
When databases are transferred to another instrument, spectral range, number of data points, spectral resolution and other parameters have to be taken into consideration. Further procedures and criteria must be applied to demonstrate that the model remains valid with the new database or new instrument.