Appendix V M. Thermal Analysis1
Thermal analysis is a group of techniques in which the variation of a physical property of a substance is measured as a function of temperature. The most commonly used techniques are those which measure changes in the mass or energy of a sample of a substance.
These techniques have different applications:
THERMOGRAVIMETRY
Thermogravimetry (TG) or thermogravimetric analysis (TGA) is a technique in which the mass of a sample of a substance is recorded as a function of temperature according to a controlled temperature programme.
Instrument
The essential components of a thermobalance are a device for heating or cooling the substance according to a given temperature programme, a sample holder in a controlled atmosphere, an electrobalance and a means of electronic signal output to a recorder or a computer.
Temperature calibration
The temperature sensor close to or in contact with the sample is calibrated using the Curie temperature of a ferromagnetic substance such as nickel. In the case of an instrument capable of simultaneously conducting TG/TGA and differential thermal analysis (DTA) or differential scanning calorimetry (DSC), the same certified reference materials as those for DTA and DSC may be used, for example, indium, tin and/or zinc.
Calibration of the electrobalance
Place an appropriate quantity of a suitable certified reference material (e.g. calcium oxalate monohydrate CRS) in the sample holder and record the mass. Set the heating rate according to the manufacturer′s instructions (e.g. 5 °C/min) and start the temperature increase. Record the thermogravimetric curve as a graph with temperature or time on the abscissa, increasing from left to right, and mass on the ordinate, decreasing downwards. Stop the temperature increase at about 250 °C. Measure the difference on the graph between the initial and final mass-temperature or mass-time plateaux, which corresponds to the loss of mass. The declared loss of mass for the certified reference material is stated on the label.
Method
Apply the same procedure to the substance to be examined using the conditions prescribed in the monograph. Calculate the loss of mass of the substance to be examined from the difference measured in the graph obtained. Express the loss of mass as Δm/m (per cent).
If the instrument is in frequent use, carry out temperature calibration regularly. Otherwise, calibration is carried out before each measurement.
As the operating conditions are critical, the following parameters are noted for each measurement: pressure or flow rate, gas composition, mass of the sample, heating rate, temperature range and sample pre-treatment including any isothermal period.
DIFFERENTIAL SCANNING CALORIMETRY
Differential scanning calorimetry (DSC) is a technique that can be used to demonstrate the energy phenomena produced during heating (or cooling) of a substance (or a mixture of substances) and to determine the changes in enthalpy and specific heat and the temperatures at which these occur.
The technique is used to determine the difference in heat flow (with reference to the temperature) evolved or absorbed by the test sample compared with the reference cell, as a function of the temperature. Two types of DSC instruments are available, those using power compensation to maintain a null temperature difference between sample and reference and those that apply a constant rate of heating and detect temperature differential as a difference in heat flow between sample and reference.
Instrument
The instrument for power compensation DSC consists of a furnace containing a sample holder with a reference cell and a test cell. The instrument for heat flow DSC consists of a furnace containing a single cell with a sample holder for the reference crucible and the test crucible.
A temperature-programming device, thermal detector(s) and a recording system which can be connected to a computer are attached. The measurements are carried out under a controlled atmosphere.
Calibration of the instrument
Calibrate the instrument for temperature and enthalpy change, using suitable certified materials or reference standards.
Temperature calibration It can be performed using certified reference materials having an intrinsic thermal property, such as the melting point of pure metals or organic substances, or the phase transition point of crystalline inorganic salts or oxides. Melting points of indium, tin and/or zinc are usually employed for calibration.
Heat-quantity calibration For accurate estimation of the quantity of heat change (enthalpic change) of a test sample, caused by a certain physical change accompanying a temperature change, it is necessary to calibrate the instrument using suitable certified reference materials. Similar to temperature calibration, heat-quantity calibration may be performed using suitable certified reference materials showing a known definite enthalpic change caused by physical changes, such as the melting of pure metals and/or organic substances, or the phase transition of crystalline inorganic salts. The heats of fusion of indium, tin and/or zinc are usually employed for calibration.
Operating procedure
Weigh in a suitable crucible an appropriate quantity of the substance to be examined and place it in the sample holder. Place an empty crucible in the reference holder. Set the initial and final temperatures, and the heating rate according to the operating conditions prescribed in the monograph.
Begin the analysis and record the DSC curve with the temperature or time on the abscissa (values increasing from left to right) and the energy change on the ordinate (specify whether the change is endothermic or exothermic).
The temperature at which the phenomenon occurs (the onset temperature) corresponds to the intersection (A) of the extension of the baseline with the tangent at the point of greatest slope (inflexion point) of the curve (see Figure 2.2.34.-1). The end of the thermal phenomenon is indicated by the peak of the curve.
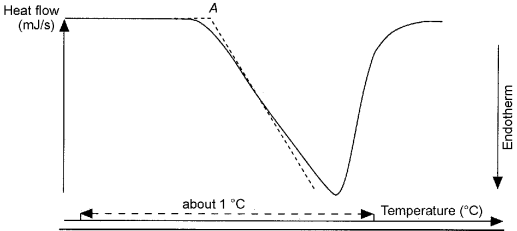
The enthalpy of the phenomenon is proportional to the area under the curve limited by the baseline; the proportionality factor is determined from the measurement of the heat of fusion of a known substance (e.g. indium) under the same operating conditions.
Each thermogram may be accompanied by the following data: conditions employed, record of last calibration, mass of the sample and identification (including thermal history), container, atmosphere (identity, flow rate, pressure), direction and rate of temperature change, instrument and recorder sensitivity.
Applications
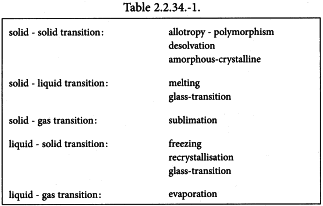
Phase changes Determination of the temperature, heat capacity change and enthalpy of phase changes undergone by a substance as a function of temperature. The transitions that may be observed include those shown in Table 2.2.34.-1.
Changes in chemical composition Measurement of heat and temperatures of reaction under given experimental conditions, so that, for example, the kinetics of decomposition or desolvation can be determined.
Application to phase diagrams Establishment of phase diagrams for solid mixtures. The establishment of a phase diagram may be an important step in the preformulation and optimisation of the freeze-drying process.
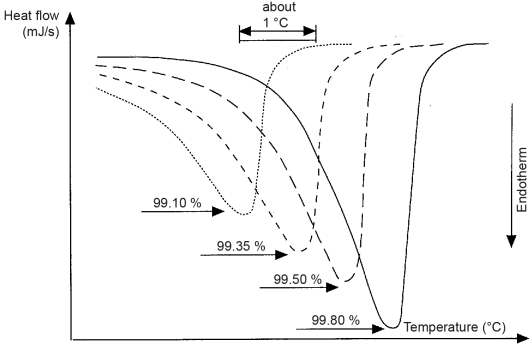
Determination of purity The measurements of the fraction of substance melted at a given temperature and the heat of fusion by DSC enable the impurity content of a substance to be determined from a single thermal diagram, requiring the use of only a few milligrams of sample with no need for repeated accurate measurements of the true temperature.
In theory, the melting of an entirely crystalline, pure substance at constant pressure is characterised by a heat of fusion ΔHf in an infinitely narrow range, corresponding to the melting point T0. A broadening of this range is a sensitive indicator of impurities. Therefore, samples of the same substance, whose impurity contents vary by a few tenths of a per cent, give thermal diagrams that are visually distinct (see Figure 2.2.34.-2).
The determination of molar purity by DSC is based on the use of a mathematical approximation of the integrated form of the van′t Hoff equation applied to the concentrations (not the activities) in a binary system [ln(1-x2)≈-x2 and T × T0≈T20]. For low amounts of impurities (x2 ≪ 1) and for temperatures close to the melting point T0 the equation can be written as follows, in which T and x2 are variables:
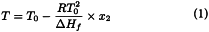
| T | = | temperature of the sample, in kelvins; |
| T0 | = | melting point of the chemically pure substance, in kelvins; |
| R | = | gas constant for ideal gases, in joules⋅kelvin-1⋅mole-1; |
| ΔHf | = | molar heat of fusion of the pure substance, in joules⋅mole-1; |
| x2 | = | mole fraction of the impurity, i.e., the number of molecules of the impurity divided by the total number of molecules in the liquid phase (or molten phase) at temperature T (expressed in kelvins). |
Hence, the determination of purity by DSC is limited to the detection of impurities forming a eutectic mixture with the principal compound and present at a mole fraction of typically less than 2 per cent in the substance to be examined.
This method cannot be applied to:
During the heating of the substance to be examined, the impurity melts completely at the eutectic temperature. Above this temperature, the solid phase contains only the pure substance. As the temperature increases progressively from the eutectic temperature to the melting point of the pure substance, the mole fraction of the impurity in the liquid phase decreases, since the quantity of liquefied pure substance increases.
For all temperatures above the eutectic point:

| F | = | molten fraction of the analysed sample; |
 | = | mole fraction of the impurity in the analysed sample. |
When the entire sample has melted, F = 1 and x2=.
If equation (2) is combined with equation (1), the following equation is obtained:
The value of the heat of fusion of the pure substance is obtained by integrating the melting peak.
The melting point T0 of the pure substance is extrapolated from the plot of temperature T (expressed in kelvins) versus 1/F. The slope α of the curve (obtained after linearisation, if necessary) corresponding to  , allows to be evaluated.
The fraction multiplied by 100 gives the mole fraction in per cent for total eutectic impurities.