|
|
|
|
|
|
|
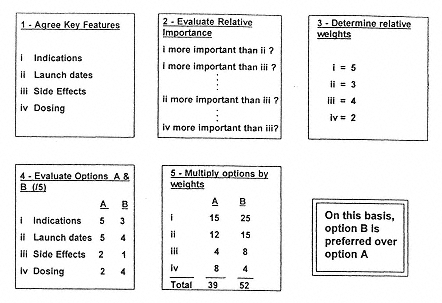
FIG. 7
An example of use of a multiattribute analysis. |
|
|
|
|
|
|
|
|
This approach is intuitively attractive because it seems to mirror the reality of R&D work. The problem is that the analogy between the financial options market, for which the model was devised, and pharmaceutical R&D is considered unproven by some. |
|
|
|
|
|
|
|
|
This section suggests some approaches to presenting key portfolio information to enable decision making. In the introduction to this chapter, it was noted that the aim of portfolio review is to balance risk, reward, and resources. These elements should be addressed in the data analysis. |
|
|
|
|
|
|
|
|
The most common and readily interpreted output is a simple plot of risk versus return where return is determined by a financial measure such as return on investment (ROI), internal rate of return (IRR) or net present value (NPV). Return may equally be represented by a surrogate for these |
|
|
|
|
|