Appendix II L. Chemical Imaging
1 SCOPE
Chemical imaging (CI) combines spatially resolved sensing technologies with data analysis techniques to characterise a sample in chemical and physical terms, using information primarily obtained from its surface. Chemical imaging is particularly suited to the analysis of solid, semi-solid and liquid samples with regard to material properties, including component identity (active pharmaceutical ingredients and excipients), domain size and distribution, polymorphism, and particle morphology. Thus, imaging can be applied to assess identity, quality and quantity of active ingredients, intermediates, and excipients in bulk or solid dosage forms, biological samples, packaging and devices. Imaging is used to explore sample homogeneity, detect physical sample defects (e.g. cracks in cores or coatings), and identify foreign particles or contaminants. It also facilitates process understanding and root cause determination. Lastly, it is a tool to evaluate falsified or counterfeit medicinal products.
This general chapter’s primary focus is on chemical imaging systems (CIS) based on surface analysis performed with vibrational spectroscopy, e.g. mid-infrared spectroscopy, near-infrared spectroscopy and Raman spectroscopy. However, it also applies to other techniques that supply images.
It offers specific recommendations to assess the performance of chemical imaging systems for the qualitative and quantitative exploitation of images. Where chemical imaging systems are primarily intended for investigative purposes, the performance requirements for infrared absorption spectrophotometry (2.2.24), near-infrared spectroscopy (2.2.40) and Raman spectroscopy (2.2.48) need not be applied. Instead, individual criteria have to be established using a risk-based approach.
2 ASPECTS OF CHEMICAL IMAGING
2-1 DEFINITION
Chemical imaging of pharmaceutical samples is a method that consists of a collection of responses to the illumination at multiple wavelengths of positions spatially distributed across the sample surface. For a given surface location (pixel), a set of responses will be associated with the impinging wavelengths. When x and y positions are varied successively over the range of wavelengths and responses are collected at each location, an image of a wide surface of the sample is constructed.
Imaging systems resolve spatial information primarily at the sample surface. Chemical and morphological sample characteristics or features are collated into an image made up of contributions from multiple domains distributed on the surface of the sample. As a result each mapped sample point (pixel) contains a wealth of information, and the recorded signal reflects chemical and physical properties such as ingredient identity, concentration, crystallinity, orientation, domain size and particle size.
2-2 IMAGING MODES
Chemical images may be acquired in broadband, multispectral or hyperspectral modes. An example of the broadband mode is the camera, where filters are used to weight the relative importance of different wavelengths for the 3 colour variables red, green, and blue (RGB). Multispectral imaging involves sampling spectral bands that may be spread unevenly, not unlike a combination of different detectors in different frequency ranges.
Hyperspectral imaging (HS imaging, HSI) is a two-dimensional (2D) visualisation technique that records a full range spectrum for each pixel. In practice, HSI expands spectroscopic single point analysis of samples into 2D projections of a slice of finite depth for each measured area of the sample. Hyperspectral sensors take advantage of numerous contiguous channels to uncover features that usually cannot be resolved using the average spectra obtained from a single measurement in classical spectroscopy. Images may be produced with a spectral quality similar to that of conventionally obtained spectra. However, this comes at the cost of longer measurement times, larger amounts of data, and complex computation. The spectral quality is sometimes lowered to increase the image throughput. Sample domains may include complex spectral patterns embedded in the individual pixel data that cannot be identified solely by visual inspection, and appropriate image analysis is required to extract analytical information from such a multitude of measurements. Computational and numerical methods are essential for processing, extracting and analysing content in hyperspectral images.
2-3 DATACUBE
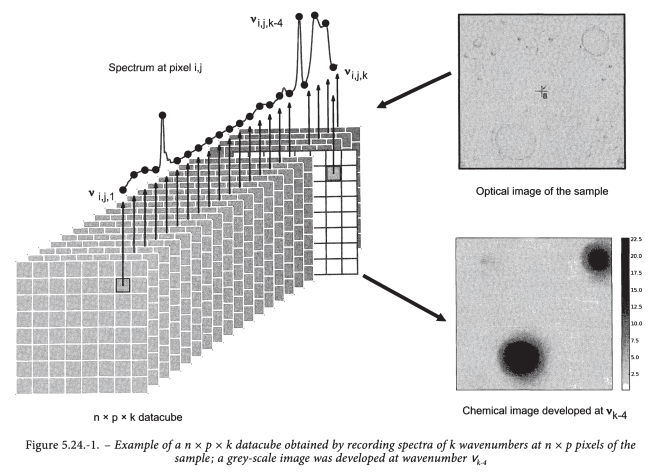
In hyperspectral imaging each pixel is associated with one spectrum. Measurements are spread over both dimensions of the sample surface. At each measurement, a column vector of dimensions equal to the number of recorded spectral data points is associated. As a result, data is packaged into a three-dimensional array called a datacube or hypercube. The datacube is a signal intensity data set made up of the pixel x-y coordinates and the corresponding series of responses (e.g. absorbance or transmittance) to the scanned spectrum (see Figure 5.24.-1).
Not unlike classical spectroscopy, which gathers chemical and physical information about the single area under examination, imaging captures spectral and spatial characteristics of surface areas. Spectral and spatial analysis of image pixels can be iterative, or combined in no particular order.
2-4 HIGHER DIMENSIONAL CHEMICAL IMAGING
Spatially resolved three-dimensional imaging can be seen as extending spatial resolution along a third direction (z) that complements x-y imaging. It is the process of stacking a collection of images covering a depth into the sample which is larger compared to the analysis depth. This can be obtained indirectly (invasive, destructive process), by sequentially collecting images of appropriately prepared solid samples, e.g. by slicing the surface stepwise with a microtome. Meanwhile there are techniques which enable direct (non-invasive, non-destructive process) 3D imaging of solids using x-y-z spatially resolved spectroscopy. These include tomography methods such as optical coherence tomography (OCT), far-infrared (FIR)/terahertz (THz) and time-domain THz spectroscopy, confocal Raman, and others, for example, X-ray tomography or nuclear magnetic resonance imaging (MRI). Ultimately 4D and higher dimensional imaging would mean simultaneous spatial (x, y, and z) and spectroscopically resolved mapping. Although higher dimensional imaging is not within the remit of the current general chapter, similar recommendations may initially apply.
2-5 APPLICATIONS
Visual display of the distribution of sample surface features complements classical analytical methods by facilitating rapid and non-destructive comparison between samples. CI can be used to analyse small to large surface areas of a sample. Imaging comes into its own as soon as constituents and morphological characteristics differ from one position to the next. Thus, the technique is particularly suited to exploring samples that are heterogeneous with regard to chemical content and physical morphology. Imaging captures the distribution of selected components and features, i.e. attributes of various parts of a sample. For example, images can display the location of features that directly impact product performance. They can show whether a component is evenly distributed on a relevant scale. Therefore, it is important to choose CI methods depending on the needs with regard to spatial resolution.
The main applications of chemical imaging focus on solid-state property analysis, determination of chemical or physical features, contaminant identification, anti-counterfeit, and chemical identification. For example, the measurement of thickness and uniformity of coating on tablets, and the characterisation of surface properties, such as component mapping, determination of adhesion force and deformation depth, can be considered. Moreover, particle characterisation can be performed based on measurements of size, agglomeration and morphology, determination of roughness of the surface, and detection of broken particles and foreign particles. Analysis of particles can also be performed in liquids.
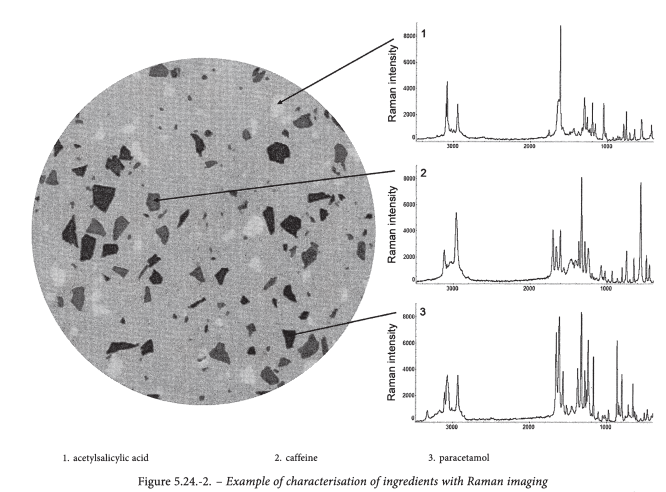
Spatial distribution of different polymorphic forms can be analysed with CI techniques and the investigation of polymorphic transitions and multiphasic materials (e.g. solid dispersions) can also be considered. The characterisation of nano- and micro-crystalline materials can be performed to monitor structural changes under stress conditions and over time, and to evaluate defects in crystals, for example, resulting from milling and micronisation of the material. The chemical characterisation of samples based on chemical images is mainly performed to identify and characterise the distribution and abundance of individual components in a mixture based on characteristic spectral features (see Figure 5.24.-2). This analysis can be performed to determine molecular but also atomic elemental species present on the surface. The kinetics and mechanism of active substance dissolution and release can be modelled, and, as another example, the drug concentration gradient between the solid/solution interface and the bulk solution can be determined.
2-6 CHEMICAL IMAGING SYSTEMS
The selection of a specific imaging instrument or technique depends on the particular analytical application intended. A chemical imaging system is characterised by setup, spatial and spectral resolutions, magnification, type and size of sample, sample preparation and presentation, moving or resting sample, acquisition time, number of measurements, data analysis algorithms, software, etc.
Numerous techniques enable the production of hyperspectral images. A brief description of techniques relying on vibrational spectroscopy is given below, along with their potential uses and limitations.
Mid-infrared (MIR)
MIR spectroscopy is based on the interaction of light with the sample, for the study of intra-molecular vibrations of a material. The electromagnetic spectrum range usually spans the region of 4000-400 cm-1 (2.5-25 µm). MIR imaging may be used for the characterisation of chemical species in a mixture of ingredients. Measurements are often carried out using attenuated total reflectance (ATR) microscopy where the sample is in contact with an IR-transparent crystal of higher refractive index than the sample. The measurement may be difficult for samples with excessive moisture due to interference with water bands.
Near-infrared (NIR)
NIR spectroscopy detects molecular vibrations originating from C-H, N-H, O-H and S-H overtones, and combinations of fundamental mid-infrared vibrations. The electromagnetic spectral range usually extends from 12500-4000 cm-1(0.8-2.5 µm). The measurement is contactless, usually in diffuse reflectance mode, and delivers physical and chemical information.
Far-infrared (FIR) and terahertz (THz)
In the FIR range, electromagnetic radiation typically spans from 400 to approximately 10 cm-1 (25-100 µm). This allows spectra to cover inter-molecular and lattice vibration modes. The selectivity of the technique to the hydrogen bonding networks makes possible the identification and characterisation of solid state forms, e.g. polymorphic forms and degree of crystallinity.
The radiation can pass through a wide variety of non-conducting materials, but cannot pass through conducting materials such as metal and water, and penetrates deep into the sample.
Raman
Raman spectroscopy detects frequency shifts originating from the inelastic part of the light scattered by a sample previously irradiated with an intense monochromatic light source (usually a laser). Raman spectra contain numerous narrow bands which makes possible the identification of chemical substances. As a result, Raman imaging gives information on chemical species in a sample (including polymorphs).
Water, air and glass are weak Raman scatterers and therefore the analysis of aqueous samples may be performed in atmospheric conditions or in sealed vials. However, the measured signal may be disturbed by fluorescence.
2-7 ACQUISITION MODES
Either spatial sequencing or wavelength sequencing techniques are required to produce an image. The 3 modes used to record datacubes are point mapping, line mapping and global imaging. Point mapping (point scanning) is the simplest and typically follows a rectangular grid pattern. A spectrum is recorded at each point on the grid with the sample stage being moved to the next neighbouring location. Scanning is computer-controlled along both spatial axes. In line mapping (linear scanning), the sample is illuminated along a line and the image signal is dispersed along one spatial axis onto the detector. The sample is moved along the other spatial axis to capture the next neighbouring line until full mapping is eventually achieved. Here the speed and flexibility of the experimental setup enable on-line application of continuous CI. Global imaging (focal plane scanning) is performed when all image points of a sample are imaged simultaneously onto the detector array. This can be done on a per wavelength basis with filters or tuneable filters.
2-8 RESOLUTION
Pixels contain a wealth of contributions from chemical and physical features occurring at the surface and near sub-surface of the sample. The performance of an imaging system is directly related to the spatial and spectral resolutions that can be achieved. Linear line mapping systems are more sensitive to spatial interference, whereas spectral resolution is more critical with focal plane acquisition.
Depending on the imaging technique, spectral resolution may be affected for example by laser wavelength, grating, detector and spectrometer focal length. Spectral resolution has an impact on chemical feature extraction because it provides the precision required for qualitative and quantitative image analysis, e.g. identity of ingredients.
Spatial resolution is the smallest distance between two consecutive points which can be distinguished. It has an impact on image processing as information may appear as unresolved. For example, the domain size of components of interest should be consistent with the spatial resolution achieved by the system. The spatial resolution obtainable is limited by the instrument characteristics, for example spot size of the laser, diffraction limits, detector size, magnification, numerical aperture, etc. The spatial resolution obtained by a specific CI system is also affected by the diffusion of radiation across the sample surface. Scattering occurring below the surface is likely to distort the image obtained and limit the spatial resolution.
2-9 REPRESENTATIVENESS OF SAMPLE SURFACE
Depending on the instrument setup, the topology of the sample surface may impact imaging performance.
The sample surface investigated has to be representative for the intended purpose of analysis. Depending on the latter, the impact of sample homogeneity has to be evaluated. For example, with a design based on reflectance, due to the limitation of penetration depth and spatial resolution, a true measure of morphology or distribution of particle shapes in the sample is only estimated. Thus, results obtained from surface image analysis may not be representative of the whole sample because it may not be homogeneous.
One approach to overcome this limitation would be to measure a number of cross-sections of the sample to improve estimations for the whole sample. Another approach would be to use an alternative optical design where penetration depth can be increased, e.g. confocal or spatially resolved offset measurements to capture information near the surface, tomography or transmission measurements to collect whole matrix information.
3 ELEMENTS OF A CHEMICAL IMAGING PROCESS
Proceeding with imaging encompasses numerous steps such as:
3-1 SAMPLE
3-1-1 Sample preparation
Sample preparation has to be in accordance with the imaging technique used. In situ measurements with probes can be performed without sample preparation. On the other hand, setups for Raman scattering for example proceed by non-contact focusing, meaning that the sample surface may need to be prepared to obtain a reasonably flat surface. If the instrumentation is unable to compensate for topographical variation, sample surfaces may be mechanically modified, for example by flattening a concave tablet surface. Focusing adjustments by automatic refocusing during mapping compensates for slightly uneven surfaces. Sample surface preparation has also to be considered with ATR-IR imaging for which contact between optics and sample is required.
3-1-2 Sample presentation
Appropriate sample presentation is dictated by instrument setup. A particular setup will be more or less adapted to a specific sample type and analytical task. The sample is positioned so that it is optimally imaged. The setup is optimised to reduce specular reflection as much as possible. Angles and distances between probe (or beam), sample and detector match the setup requirements.
3-2 CONTROL OF INSTRUMENT PERFORMANCE
Evaluating both instrument performance and image analysis methods is essential to avoid misinterpretation or artefacts. Parameters include spectral as well as spatial components. The instrument is to be used according to the manufacturer′s instructions.
Instrument performance verification consists of periodic performance qualification as well as system suitability tests. The intervals depend on the use of the instrument and its application. The system suitability tests are carried out before measurements to check if the CI system is operating properly for the intended application.
The parameters to be assessed and the acceptance criteria applied during performance qualification and system suitability tests have to be justified and depend on the CI technique and the purpose of the analysis. Parameters which might be verified are described below.
3-2-1 CIS component adjustment
In a schematic setup, a typical CIS would be made up of components including source of radiation, optical devices, sample holder, detector, and software.
The system and its individual components comply with all expected requirements.
3-2-1-1 Sources, optics and detectors
Source intensity is monitored as part of the setup verification. In particular, the source intensity should be verified before starting calibration routines or a new series of sample measurements. Optical path, confocality, wavelength accuracy and energy throughput at any x-y position (pixel) match the specifications.
Alignment of optics, sample and detectors comply with measurement requirements in terms of distances, angles and polarisation. This alignment may shift with the temperature. In particular, illumination of the sample or regions of interest has to be as homogeneous as possible and reproducible.
Parasitic or adverse effects, for example scattering, background, noise, bad pixels, cosmic rays and fluorescent lights in the laboratory, and side effects such as sample fluorescence have to be controlled. Stray light, ghost lines, and ghost images can be caused by reflections from imperfect surface elements. They constitute parasitic light that has to be dealt with.
3-2-1-2 Multi-wavelength and multispectral systems
Multi-wavelength systems should be tested at wavelengths spread over the wavelength scale using the peaks of the selected reference standard with good signal-to-noise properties.
Multispectral systems are verified for all signal sources involved.
3-2-1-3 Mapping
When images from more than one instrument are going to be aligned, it is important to have verified x-y scales.
3-2-1-4 Magnification
In the case where the CIS permits different magnifications, the optical or electronic magnification level needs to be optimised. If magnification is inadequate for resolving relevant features, the value of imaging may be diminished; whereas if magnification is set higher than required, the field of view is reduced.
3-2-2 Calibration
The purpose of calibration is to transform the recorded signal into data suitable for analysis, interpretation, or comparison with reference data.
Basic instrument calibration of imaging systems consists of x- and y-axis calibration in both wavelengths and intensity.
3-2-2-1 Spectral axis
Optimal wavenumber accuracy is critical and should be achieved at the same level as for a standard spectrometer. Spectral axis calibration assigns wavelength and intensity values to every mapped pixel of the sample surface. To determine these relationships, well-characterised light sources or reference materials can be used. Calibration should be carried out using referenced and certified/normalised internal or external standards provided either by the supplier or a third party. Technology and environmental conditions are other critical points.
3-2-2-2 Spatial axes
Spatial axis calibration has an impact on the actual field of view of the CIS and the sampled surface area, i.e. the pixel location. Calibration corrects deformations on the spatial axis such as those caused by the optics. For example, the pixel position may be accompanied by variation of the spectral resolution from the centre towards the detector boundaries. In addition, mixing of signals from adjacent pixels can occur. Both errors change the appearance of the pixel spectra and may reduce the accuracy of subsequent data analysis. If it is not possible to deduce the position of the imaged pixels on the detector surface from the pattern on the target surface, a special test target can be used or developed for the application.
Spatial resolution in both x and y directions is also limited, for example, by image size and step size of the moving table or the conveyor belt.
3-2-2-3 Method
Appropriate data processing and modelling are needed to deliver information about the property that correlates with the observed features in images. Calibration related to the analytical objective requires, for example, identifying and estimating a characteristic identity or morphological features of the sample.
3-3 IMAGE PROCESSING
Processing means that the image is treated for display and subsequent feature estimations. Imaging requires steps to improve the image for analysis, e.g. to control brightness and contrast, reduce noise, sharpen edges and borders, remove unwanted features, etc. This improvement allows features to be recognised i.e. separated and discriminated from the background.
Chemical images are generally processed by chemometric modelling for qualitative or quantitative purposes (see general chapter 5.21. Chemometric methods applied to analytical data).
3-3-1 Spectral selection
Image contrast is built upon specific signatures of the components at the sample surface and derived from spectroscopic data such as peak intensity, peak position, baseline variations (scattering differences), or values calculated with multivariate analysis.
3-3-2 Image pre-processing
Data analysis methods for imaging data sets usually begin with the same steps as for single point spectroscopy. Pre-processing is utilised to separate chemical and physical effects, unless an analysis is based on the physical effects (e.g. scattering differences seen as baseline variations). The collected data is typically affected by noise or instrumental distortions and pre-processing is often applied to improve image quality. There may also be a need to remove irrelevant sources of variation such as cosmic ray spikes or stripes due to detector configuration. Common pre-processing operations for spectra are: baseline correction, derivatives, smoothing, wavelet-based filtering, standard normal variate (SNV), multiplicative scatter correction (MSC), normalisation, truncation and Fourier-transform. It has to be verified that pre-processing does not cause artefacts.
3-4 IMAGE ANALYSIS
Pixel arrangements in an image of the sample represent a map of the distribution of chemical or physical properties or features. Depending on the objective of the analysis, data can be explored for spectral features, spatial features, and a combination of both. Examination of the datacube can be performed in a direct way, as for conventional spectroscopy (e.g. by analysing height of peaks or area ratios), or by techniques including image processing, multivariate data analysis, etc.
3-4-1 Visual exploration
A review by the user of an image displayed on screen may deliver a first impression before beginning enhancement, exploration and evaluation. Images can be analysed for features at the surface of the sample, such as location, distribution, size and shape of domains, constituent identification, etc. Standard image processing tools, such as morphological filtering and particle statistics, may be applied directly for samples that are significantly heterogeneous.
For a chemical image, both spectral and spatial analyses can be equally important and there are different steps of chemical image analysis. Spectral and spatial analyses are often iterative by nature. In practice, the methods used depend upon whether it is the spectral information or the spatial information that is of more interest. The goal is to reduce data dimensionality and extract as many features as possible. Unsupervised multivariate analysis such as principal component analysis (PCA) may be applied prior to feature extraction to describe the information contained in the image. A preliminary segmentation of PCA images may be used to facilitate identification of regions of interest in the image for further processing. If the ingredients of a mixture are known and available for reference measurements, the corresponding data is used to reduce the number of spectral layers in the hypercube down to a few chemically or physically meaningful layers by using supervised regression methods, e.g. multivariate curve resolution-alternating least squares (MCR-ALS), independent component analysis (ICA), and partial least squares regression (PLS).
3-4-2 Feature extraction
The extraction of chemical or morphological features of samples involves supervised techniques to perform dimensional reduction. It concentrates further image processing on characteristics that are meaningful for the analysis. For example, a selected feature could be the quantity of a given substance or a solid-state form of interest. If the sample is comprised of components whose spectral features are well separated, it is possible to proceed directly with a univariate method based on a single wavelength per feature, thus utilising only a small fraction of available data. However, in many cases spectral overlap is significant and the univariate approach is insufficient. The extraction of features can then be improved by including a greater proportion of the spectral information and applying a multivariate approach, such as clustering, classification, PLS discriminant analysis (PLS-DA), linear discriminant analysis (LDA), etc.
3-4-3 Quantification of ingredients
There are several ways to measure ingredient variation using regression methods. A quantitative model can be computed by using average spectra or binning of regions of interest at the surface of the sample. The known bulk concentration may be used when the ingredient present varies in responses for the analytical method used. This can be performed by peak integration at a single wavelength or alternative chemometric methods.
When individual pixel spectra become increasingly mixed, chemometric tools, typically multivariate data analysis, can be deployed with similar data analytical strategies as those for single-point spectroscopy.
For example, it is possible to estimate relative component abundance by using pure component spectra as the starting point. The reference spectra used to create the library are collected from separate pure component samples. These spectra can be measured with a non-imaging spectrometer, or as separate images of pure components. The inherent variation in pure component spectra when acquired across a large number of pixels provides additional statistical robustness. The reference spectra and the unknown sample can also be measured simultaneously in the same field of view to create one single data set. If pure component reference spectra can be derived directly from an isolated area of the imaged sample, there is no need to acquire additional reference spectra for calibration. A multivariate model can be developed either based on external reference spectra or based on spectra from isolated areas of the respective image.
Both with simultaneously and separately acquired pure component spectra, it is important to verify that they are representative for the present analysis by for example regression residuals.
3-4-4 Spatial analysis of image features
Spatial analysis of the images can be performed with regard to distributions of shapes, sizes and locations of domains, etc. Analysis of shape and distribution relies on a variety of numerical methods and algorithms.
Images display the samples by setting a threshold value and converting data into a set of colours or shades according to a monochrome or pseudo-colour intensity scale to underline the presence or proportion of the analytes of interest at each pixel. Alternatively, the distribution of several analytes can be combined into colour images. Further analysis can be performed, such as counting pixels, estimating the size distributions of particles of the same chemical origin, and segmentation which is a process to divide the image between regions that correspond to surface areas of interest.
3-4-5 Measuring dimensions
Images can be used for example to determine area, dimensions, perimeter, aspect ratio and roundness.
3-4-6 Statistics
Pixel statistics can be performed to facilitate further image analysis. Application of methods such as variance analysis and box-plot for domain size, shape, distribution, and distances between domains, enables estimation of the variability within an image. These methods deliver a condensed description of relations between domains in the images with simplification of the image analysis. Property estimations can also be derived from these values.